
Somehow, we’ve made it a quarter of the way through the 21st century.
It’s been a slightly bumpy ride here in the UK. Economically it’s been an especially choice few years. We learned last week that the jobs market is still struggling (although not as much as it was quite recently), and it’s far from a niche opinion to suggest we are still going through a cost-of-living-crisis.
But what about salaries?
I had a feeling that salary growth in the UK had been sluggish, and that people weren’t earning as much as they should be compared to inflation – so I decided to have a look at the data.
It turned out I was wrong… although that isn’t quite the full picture.
Here’s what I found when I looked at the ONS’s datasets on average earnings.

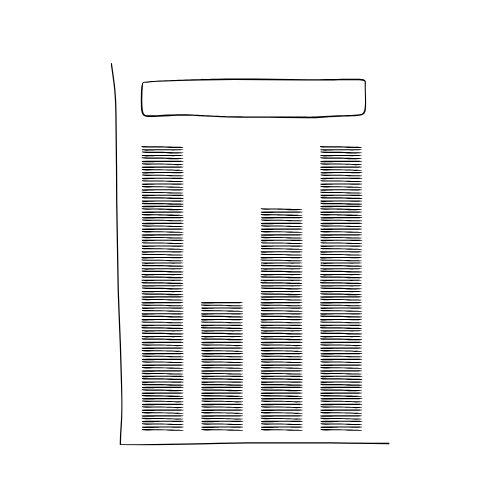
Let me talk you through: the solid line shows the actual average weekly salary (including bonuses) for each year from 2000 up to 2025 (going as far as June for this year). The dotted line shows the start year’s average salary, which has then been adjusted for inflation (CPI) for each subsequent year.
So the further the solid line is above the dotted line, the better salaries have fared against inflation.
You can adjust the industry as well as the start year.
Since 2000? We’re actually doing OK, apparently. The average weekly salary across the whole economy has more than doubled, from £313 up to £735, while if wages had simply kept track with inflation they would be a mere £591.
And what’s also quite encouraging is that salaries seem to have outpaced inflation in every industry – there isn’t a single one where the dotted line is above the solid line.
Good news all round, then?
Well, I mean, sure. But… here are three caveats that may go some way towards curbing your excitement (unless you work in financial services).
Caveat 1: start year
The year 2000 is an arbitrary point in time, albeit a nice round one.
Adjust the dial to different start years, and you’ll find some more interesting results.
Try 2008, for instance, and you’ll spot that salaries only caught up with inflation since then last year – and they are still slightly behind in the public sector. In a few industries, notably mining and quarrying, and the mysterious ‘other service activities’, the lag is very pronounced indeed. Education is another notable one that has not yet caught back up with inflation since the financial crisis.
(Your sympathy for miners and quarriers(?) might be slightly tempered when you spot the scale of numbers we’re dealing with – they’ve been earning an average of more than £1k a week since 2008.)
So while the general picture this millennium remains positive, that isn’t to say it’s necessarily good news since, say, you first started working, or since any other point in time.
Caveat 2: sectors
When I first did this analysis, I was a little bit surprised, because I’ve mainly worked in media.
Where is media on that graph, you ask? Most of it is tucked snugly into ‘Information and Communications’. Which, as you may well have spotted, is a bit of a breakout success, with weekly salaries having soared to almost £300 a week more than their inflation-adjusted 2000 equivalent. And that is of course because the sector also includes IT.
The full breakdown of what’s included within Information and Communications is:
- Publishing activies;
- Film/video/TV production, sound recording, music publishing;
- Programming and broadcasting;
- Telecommunications;
- Computer programming, consultancy and related activities;
- Information service activies.
Print and online journalism falls within ‘Publishing activities’.
Unfortunately the ONS salary breakdown doesn’t go into that level of detail – we’d need to find some much more niche (and probably much less reliable) statistics to explore media salaries further. Alternatively, employment figures could map the changing numbers employed – and you’d certainly expect to see a diminishing number of people in ‘Publishing activities’, whereas computer programming will surely have experienced a big enough boom that any lower figures coming from other subsectors are blown out of the water.
So my suspicion that media professionals have not, as a whole, got on particularly well in the last 25 years has not been fully assuaged by this analysis, although it’d require further digging to back the point up properly.
The same sort of point applies equally, of course, to any number of other subsectors. Health and social work are grouped together, for instance, which makes good enough sense – but I wonder how social workers really have got on as opposed to doctors.
Then again, it’s worth noting that some lower-paid sectors do relatively well on the graph, I would guess thanks to the influence of minimum wage rules, which came into effect just before any of this data starts, in April 1999. Accommodation and food service workers are earning way above their 2000 equivalent figures, for example, as employers have been obligated to keep up with the rising minimum wage.
On the other hand, the £342 weekly rate that workers in that sector take home today is still less than what the average public administrator was earning in 2000. Which brings me on to the third point.
Caveat 3: inequality
One problem with the above graph is that you don’t really get a sense of overall scale when comparing the sectors, because the y-axis updates dynamically. That means a line for a very wealthy sector may not look notably different from a line for a sector at the bottom of the ladder. I tried it with a fixed y-axis but it looked daft – the axis went so high up that most of the lines, except for those in finance and so on, were hard to interpret.
So here’s another graph.

This one shows something fairly similar, but in a different way. The light blue dots show the average weekly salary in 2000, and the dark dots the average for 2024. The two dotted lines, meanwhile, are those two years’ averages across the whole economy. Inflation isn’t factored into this one – these are just the real salary figures.
What I’d draw your attention to is the size of those connecting lines. I hope you agree it’s pretty clear that the lines get much shorter the lower we go down the pay scale. At the top of the scale, in finance, workers took home more than a thousand pounds more per week in 2024 than in 2000 (£1,044, to be exact). Down in accommodation and food services the difference is just £189.
In percentage terms, that’s a 181% increase for the financiers, and a 135% increase for the waiters.
Which, I’d suggest, is one way to show that despite an overall uptick in salaries since the turn of the century, it’s not really the rosiest of pictures. The wealthiest sectors are doing disproportionately better than the poorest – and that gap has widened.
One final point. On that first graph, if you set the year to 2008 and select ‘Financial and Insurance Activities’, you’ll see the average salary line catch up with inflation-adjusted 2008 levels by 2016 – it took eight years for those salaries to readjust following the financial crisis.
Yet the economy as a whole only readjusted in the same way in 2021 – after 13 years. And the public sector is still lagging behind even today, 17 years on.
Sources and notes
All data is from the ONS: EARN03 (earnings by industry), EARN02 (overall earnings), CPI (inflation). Calculations were made by adjusting the earning figures by the appropriate factor for inflation.
The graphics are made in Tableau, partly to give me enough flexibility to adjust them as much as I wanted, and partly as an exercise for me. I hope they display OK for you – if not you can see them on the Tableau site itself, here and here.
Feature image by Nicolette from Pixabay. Fun fact: if you type “payslip” into Pixabay it autocorrects you to “parsnip”.
Working files available on GitHub.
Leave a Reply