Should council tax be abolished? Thirteen Labour MPs think so. They’re certainly right to shine a spotlight on it, as council tax – for better or worse – is the source of some fascinating data.
When I taught public affairs, it was one of my favourite topics to teach, because it was simply guaranteed to get people talking – for starters because any classroom of young adults is bound to contain several who are furious at the concept of paying any sort of tax at all, and probably a few more too who erroneously believe they should qualify for some sort of discount from it.
Getting into the details was fun too. I always enjoyed watching jaws hit the floor when I told them valuations were based on what your property would have been worth if it had been sold on 1 April 1991, and indeed when I told them you could get an exemption for being a member of a religious order.
Then I’d show them my favourite graph – the first one under ‘Households – all taxes’ here – which is a beautifully clear illustration of the difference between progressive and regressive taxation. That graph, as you’ll see, is from 2022/23, so here’s an updated version with more recent figures.
The five columns represent the population, split from the poorest fifth to the richest.

Putting that together, incidentally, I found out a couple of points worth mentioning, that likely make the difference in council tax levels a little bit less pronounced overall. Firstly, because of data disclosure issues, unfortunately the figures (I assume the House of Commons graph is the same) don’t factor in council tax discounts and rebates. And secondly, if we divide the population up into ten rather than five the picture does actually change a bit:
That’s still an interesting graph, but is less clearly about council tax (that very high 9% for the poorest decile is – at least I hope it is – dealt with to some extent through discounts and benefits). Instead it raises questions about income tax and the poorest decile – I don’t think the graph is missing any data that would ameliorate that issue – and also NICs at the higher level, as those percentages start to come down at the top end of the income scale. (What about the enormity of the 40% of their equivalised income the richest decile have to pay in income tax? My suspicion is this figure seems as exceptional as it does because of just how high earnings are at the very top end of this scale.)
Regional disparities
But anyway – council tax. Another intriguing inequality within it is its uneven deployment around the country. Although very much already a known fact, this is worth reiterating: richer parts of the country tend to get lower council tax bills. If you compare Band D council tax rates to average pay for each region across the country, there is a discernible negative trend:
In other words, the richer an area is, the less council tax you’re likely to have to pay.
But I should add that what’s most interesting about the above graph is how comprehensively London skews things. Firstly – as you can see – London is home to most of the graph’s outliers, with both Westminster and Wandworth boasting exceptionally low council tax rates and much higher salaries than average. And secondly – well, see for yourself. If you click the red dot then London disappears from the graph. And that correlation starts to feel a lot flimsier.
The box plots below show the regional disparities more clearly. As above, each dot represents a local authority, but this time they’re sorted by region. The boxes span the middle 50% of councils for each region, and the central line in each box is the median.
The first slide shows that London has by far the lowest median council tax of any region in England, and the North East has the highest. The second slide shows that for salary levels those two regions simply swap places. The graphs aren’t quite mirror images of each other – but they’re bizarrely close.
Could this all be about to change? This was very much on the table as recently as this August, when Angela Rayner was in charge of local government. The Times speculated at that point that if central funding to councils was redistributed according to Rayner’s plan, wealthier areas like London would need to put their council tax up considerably.
And another thing – the empty homes premium
There are plenty of other fascinating facts about council tax, many of which can be compellingly illustrated. This in the Times is great, for instance. I’ll just add one more observation for now, which is slightly more niche.
Since 2013, councils have been able to penalise property owners for leaving places unoccupied (and unfurnished) by charging them up to 300% on top of their standard council tax bill. It’s known as the ’empty homes premium’ and is intended to bring disused properties back into use – a scheme that makes clear sense given the housing crisis.
What’s interesting, though, is that councils have a lot of discretion in how, or even if, they choose to apply this premium. And also in many cases empty properties continue to qualify for a discount or full exemption.
The table below shows the key figures for each local authority that charges council tax (billing authorities) – you can hover over the bar charts to see the number of empty properties charged at each level of council tax.
If you prefer, here’s the data sorted by region – which is a clearer way of showing that the overall picture looks broadly similar across the English regions. But if you click through to the second chart in the graphic below, you’ll see how much things vary from council to council within each region.
A few points to draw out from the graphics above:
- Four councils don’t apply the premium at all: Amber Valley, Bolsover, Castle Point and Ribble Valley
- Ten more only apply it up to 50%: Eastleigh, Hart, Runnymede, Chesterfield, Harborough, Stevenage, Wiltshire, East Staffordshire, North Warwickshire, and Tamworth
- The maximum premium of 300% is only charged by 86% of councils – 40 of them aren’t charging any properties the top rate (either by policy or because none qualify)
- Almost half of councils – 45% (134) – no longer charge any discounts on empty homes
- On the other hand, 13 councils give a discount to at least half their empty homes.
Plenty more points could be made, but that’s enough to give a sense of the considerable variation in how councils are taxing empty properties.
On the other hand
It’s only fair to point out there are many ways to explain the figures. Here are a few:
- Firstly the data was published in November 2024 (and updated on 7 March this year); it refers to a snapshot of council tax data from 7 October 2024. Some councils will have updated their rules since then, and the current numbers at each level will doubtless be a little different now
- Secondly there are of course many valid reasons that empty properties might be exempted from the premium, and I don’t mean to suggest any council is misapplying rules. Official info here lays out the various exemptions that should apply wherever you live around the country
- And just in terms of how it works – the maximum amount that can be charged depends on how long a property has been empty for. Although councils do have discretion in the exact percentage they choose to charge up to that level, only properties that have been empty for 10 years can be charged the maximum 300% rate. So a majority of empty properties aren’t eligible for that level of premium
- And relatedly, it’s important to note that all councils are dealing with different numbers of properties in the first place. All the analysis above is based simply on numbers of properties – which is why, for instance, Birmingham, the biggest LA by population, looks so huge.
It’s also worth noting that since April this year there’s a new, similar premium that can be charged on second homes.
In conclusion
I’m incredibly glad it’s not up to me whether council tax should be abolished. It’s a vital source of funding for local authorities and it’s not entirely clear exactly what it would, or should, be replaced with. But the system is strange for sure. Both its effects on different income levels, and indeed on more or less affluent parts of the country, are ripe for criticism.
And – although I appreciate there will be many cases where exemptions etc are entirely appropriate – the fact that councils seem to vary so much in how they treat empty properties does seem peculiar. The premium does, after all, have the dual effect of raising money for the council and tackling the housing shortage – yet this is one revenue-raiser that not all councils seem to have embraced.
Sources and notes
Most of the data is from the ONS: that includes the graphs on tax levels versus household income, and Band D council tax rates versus average earnings. The empty homes data is from the MHCLG’s Council Taxbase 2024.
All graphics were made with Flourish.
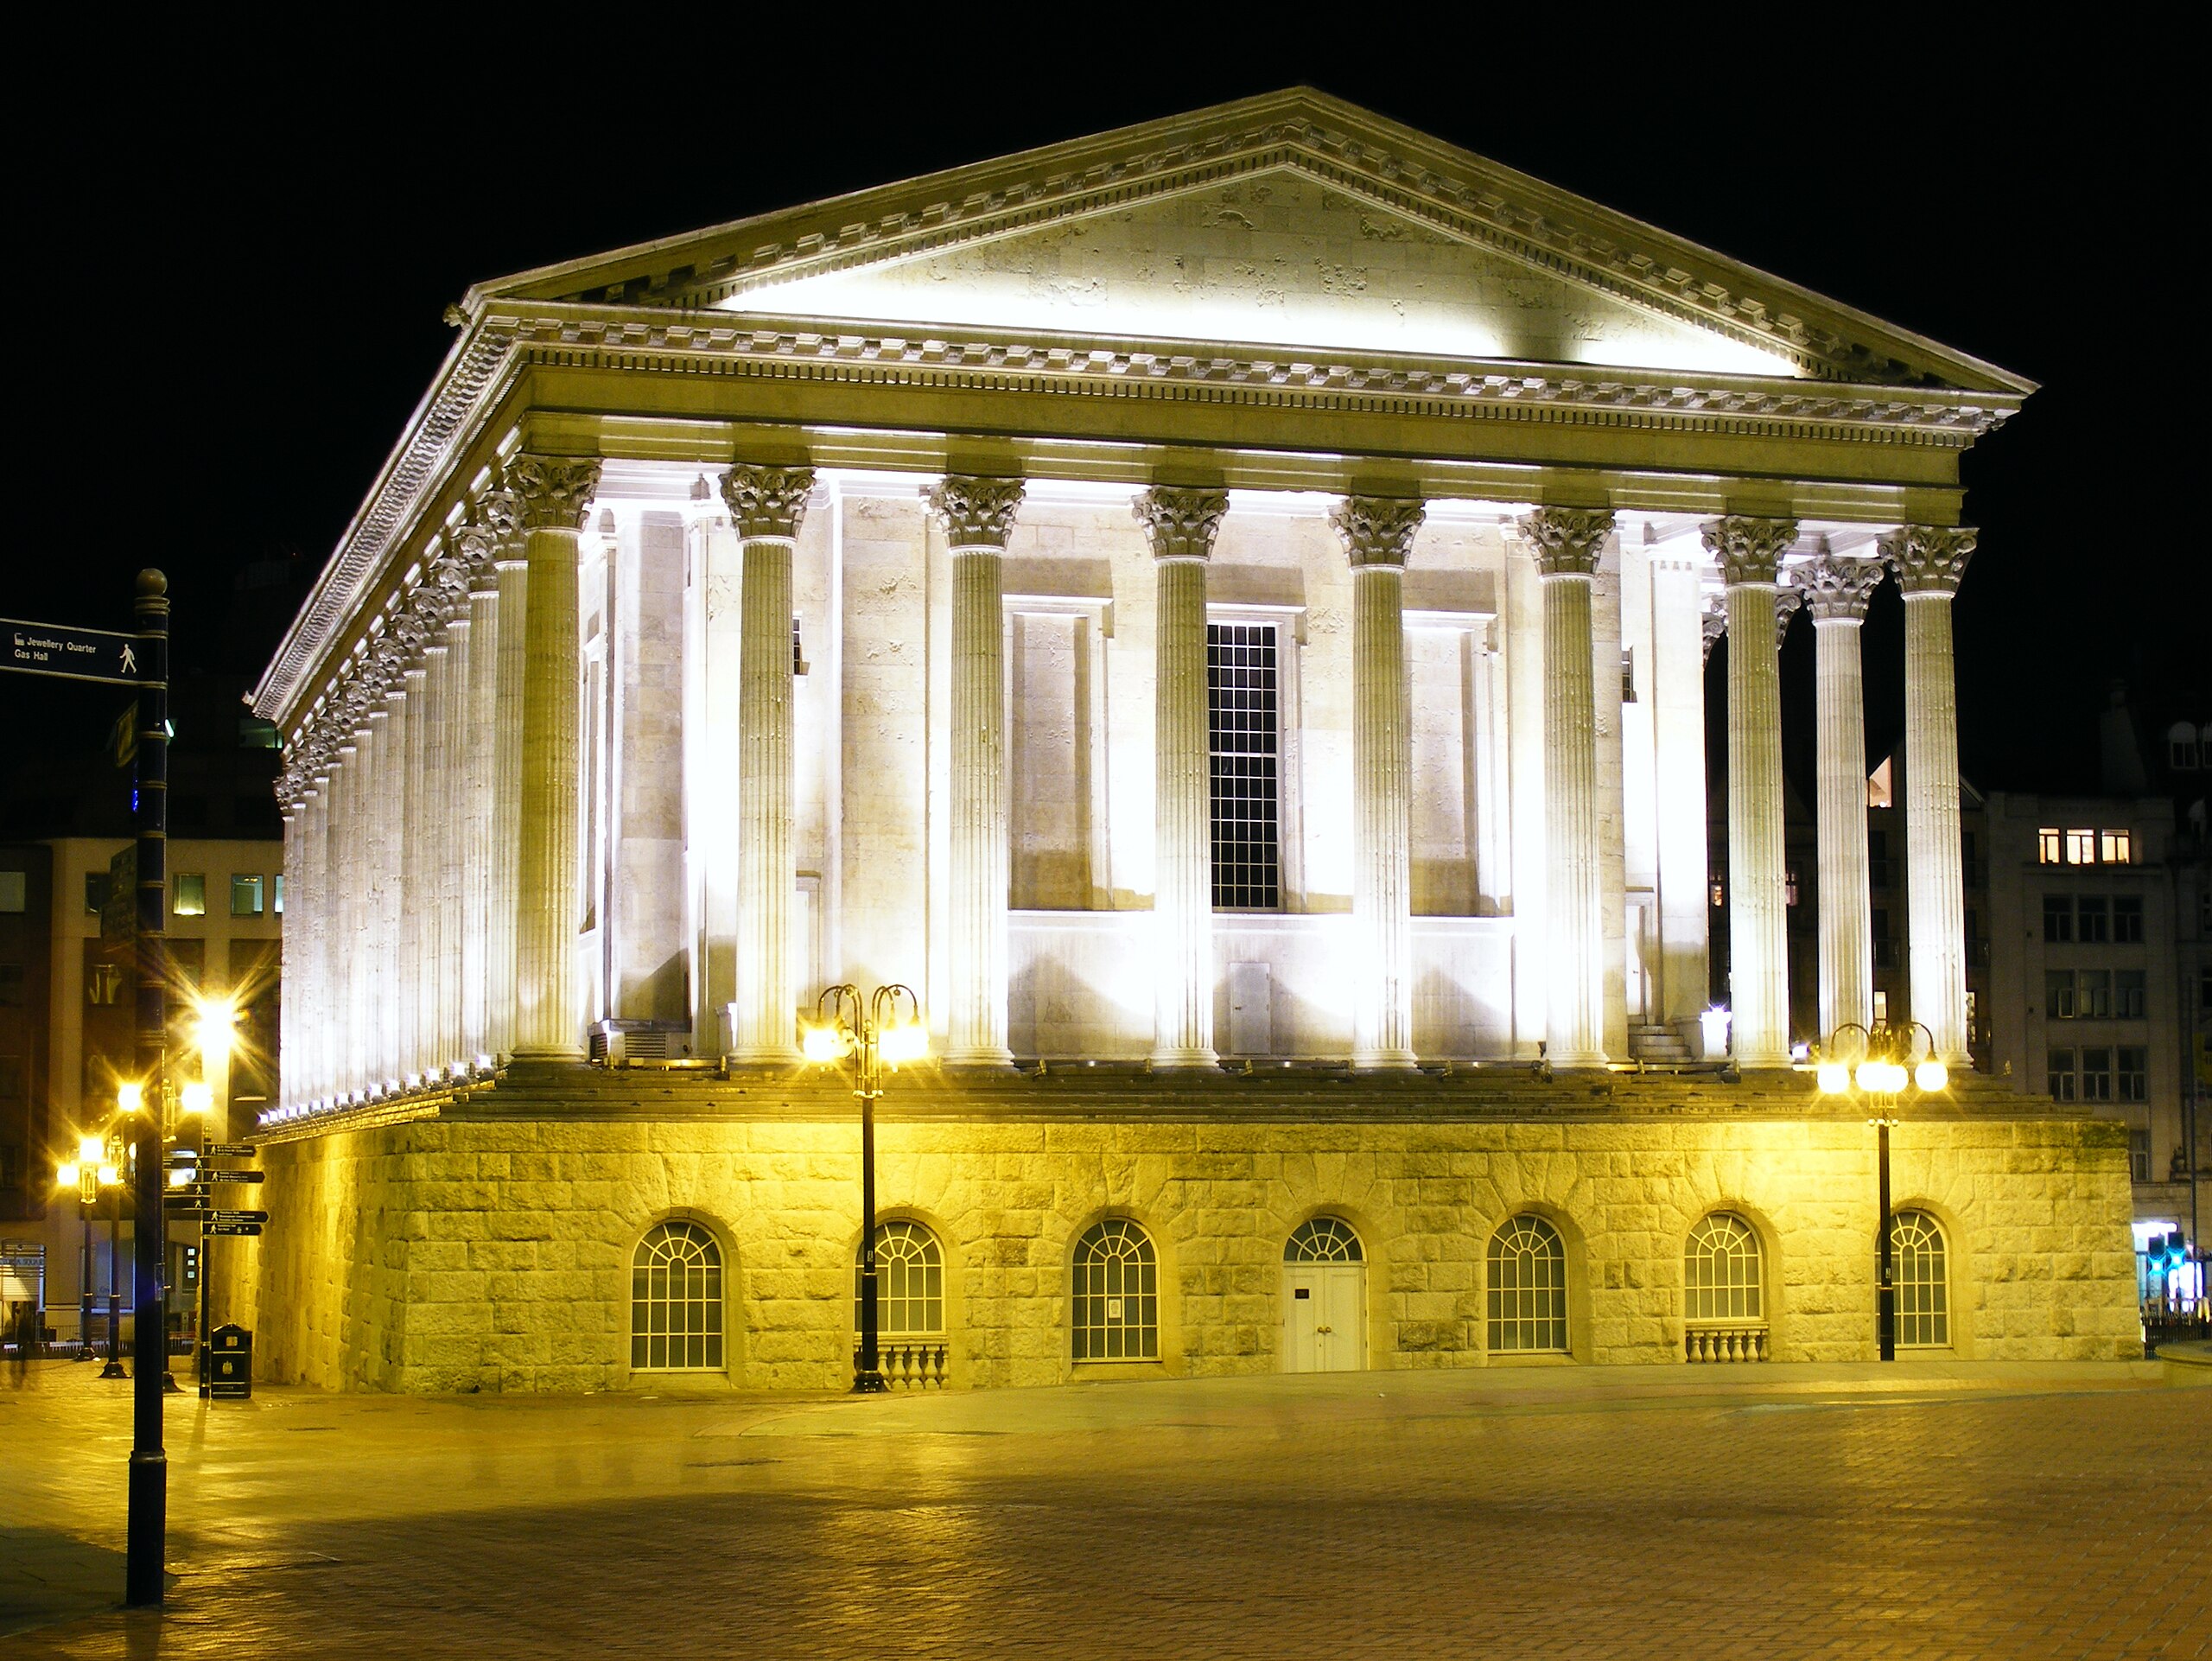
Feature image: Birmingham Town Hall. R J Higginson. CC BY-SA 3.0
Working files available on GitHub.
Leave a Reply